Echoes of past bubbles
Today’s AI surge, against a backdrop of 500bps of Fed hikes since March 2022, has some uncomfortable echoes with the lead-up to some major historical market tops.
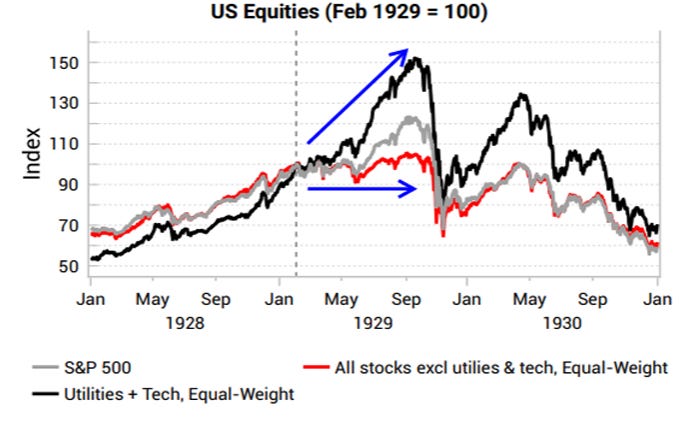
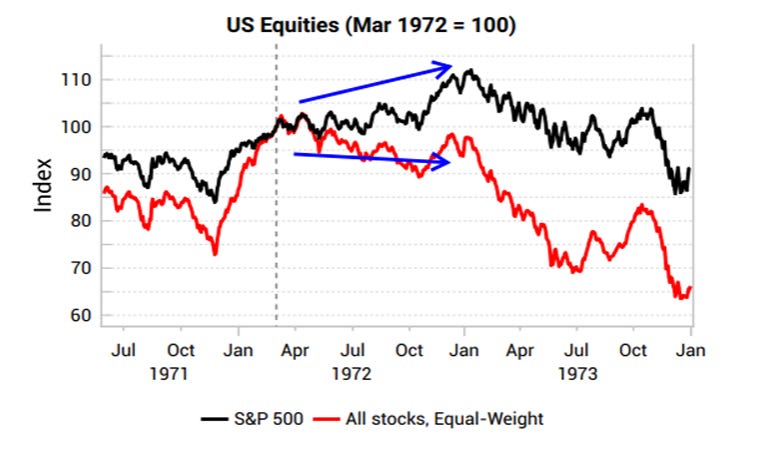
1929, 1973 and the dotcom bubbles all saw sustained monetary policy tightening and a clear divergence of surging bubble stocks vs the average stock moving sideways/falling.
The 1929 top was preceded by 18 months of tightening policy and a 9-month period of divergence between surging bubble stocks (utilities + tech, thanks to buzz around new technologies and electrification) vs the average stock.
From 1928 onwards, money supply eventually stopped expanding and rates started to rise, causing liquidity conditions to tighten. Despite this equities kept rallying and leverage kept rising (see below chart of equity prices vs brokers’ loans).
When investors bought stock on margin, their broker usually paid the difference by taking out a broker’s loan (collateralized by the stock) from a bank. When the Fed member banks slowed down their lending activities, private investors, corporations and foreign banks from Europe and Japan stepped in to offer credit. Charles Kindleberger has identified this supply of brokers’ loans from non-bank sources as responsible for fueling the boom.
Today’s surge in call volumes is reminiscent of investors sourcing alternative forms of leverage.
The end of the Nifty-Fifty bubble in 1973 was preceded by a year of rising yields, and a 9-month period where the average stock declined while market-cap weighted indices made new highs.
The 1973 top was preceded by a period of tightening liquidity conditions. The US monetary base initially dropped in March 1972, with yields starting to turn sharply higher. The Fed responded by pumping billions into the money market but yields kept rising.
The dotcom bubble saw similar divergences between surging tech stocks vs the average stock. The Fed began withdrawing liquidity in early 2000 after the Y2K scare passed. The Nasdaq peaked in March 2000, had an initial sharp correction into May, before a strong recovery into August, despite Fed hikes and falling narrow money.
This has echoes to today, with banks already tightening lending standards but pockets of the market have still been able to surge.
The below charts show Juniper Networks and Cisco during the dotcom bubble, with Juniper surging to highs in October 2000 despite a weak liquidity/credit backdrop.
The nature of bubbles is that they can go on for much longer than anyone expects. During the dotcom bubble, Ray Dalio raised concerns about “a blowoff phase of the US stock market” in 1995, while George Soros’ Quantum Fund famously lost 700m USD trying to short the internet bubble in 1997-98.
We also acknowledge the fundamentals of many of the bubble stocks today are much healthier than the profitless tech of the dotcom era. We have also already seen the deflation of SPAC (link to VP thematic) and profitless tech / innovation stocks in 2021/22.
Get the full picture at variantperception.com


