Extreme lows in liquidity indicators
With lots of noisy market narratives flooding our inbox, we share some of VP’s cyclical tools that lay out the 6-12 month investing backdrop. The below is an excerpt from our July 7th Leading Indicator Watch.
“Just when you think it can't get any worse, it can. And just when you think it can't get any better, it can.”
Global liquidity indicators are extremely negative (charts below). Growth conditions continue to worsen and the 6m+ outlook for equities remains negative.
Global excess liquidity has dipped more negative and is at its lowest level in 20+years (left-hand chart). Our Business Cycle Financing Index (BCFI) is still falling and money markets have yet to price in rate cuts (right-hand chart).
Our country growth leading indicators confirm the weak global growth backdrop (chart below). Our China LEI is still making new lows and our eurozone LEI is collapsing.
The saving grace for now is that our US LEI is in positive territory. But there is more evidence that the end of the bullwhip effect will darken the US growth outlook.
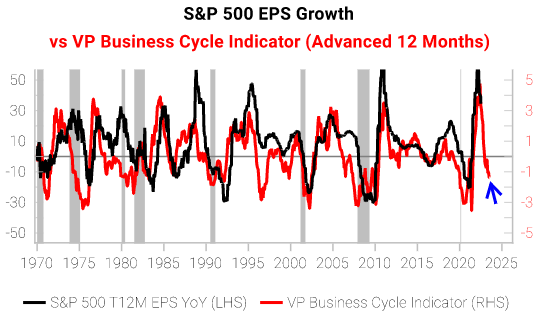
Our business cycle indicator is at worse levels than mid-cycle slowdowns of 2012, 2015 and 2018 (last chart). Our indicator combines the best long-leading growth and liquidity inputs, and provides an extremely good lead on corporate earnings growth.
Other than tactical tools pointing to the potential for a bear market rally, we remain cautious on the 6m+ outlook for equities.
Get the full picture at variantperception.com


