G3 divergence: EZ best, China worst, US outlook suits steepeners - VP July G3 Leading Indicator Watch
This post is an excerpt from the Global & China sections in our July 9, 2024 G3 Leading Indicator Watch report to VP clients. The full length, original report can be viewed here.
Full report summary
Global: China remains bad outlier, EZ & US LEI recovery continues
US: Sideways growth, ISM vs S&P services PMI gap a known issue. Consumer & labor deep-dives suggest reduced left tails. Inflation outlook not smooth sailing, but enough room for Fed “hawkish” cut if needed. 2s10s 1y forward remains inverted => steepeners now a better proposition for US macro outlook.
China: Growth and inflation leading data continues to deteriorate, investors remain in “show me” mode. Unofficial sources of FX support likely exhausting, expect slow and managed RMB depreciation.
Eurozone: Still unambiguous improvement in growth leading data. Inflation under control as services price survey drops further.
Global: China remains bad outlier, EZ & US LEI recovery continues
Within the G3, the story remains the divergence between deteriorating Chinese leading indicators vs the recovery seen in Eurozone and US LEIs (both growth and inflation).
The Eurozone growth LEI recovery remains the most pronounced in the G3 (grey line in below chart), while our China growth LEI is still dropping. We still favor pro-cyclical investments / trades linked to a Eurozone recovery.
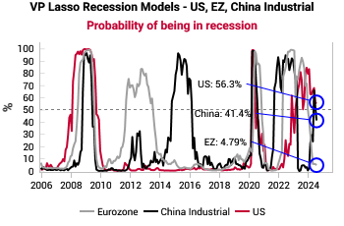
This G3 divergence theme is corroborated by our recession regime probabilities. Chinese recession probabilities have jumped higher again since Apr 2024, while Eurozone recession probabilities have steadily declined to <5% today since peaking in Jul 2023.
The US recession probability has also been steadily dropping since the Nov 2023 highs. In this cycle, the elevated US recession probabilities have only translated into localized stress in manufacturing and credit card delinquencies without more broad feedback loops thanks to persistent fiscal deficits (link, link, link).
Our global inflation input diffusion remains fairly elevated (i.e. what % of the inputs into our country inflation models are rising QoQ). This implies that the “hawkish” cut will remain the default for most major central banks in 2H24, as the inflation data will likely not improve enough to allow aggressive cuts.
China: growth and inflation leading data continues to deteriorate, investors remain in “show me” mode
China remains a clear bad outlier, with both growth and inflation leading indicators still falling, even as most other countries are seeing improvement in their leading indicators.
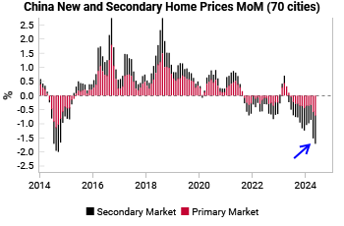
Given the weak onshore animal spirits, a string of easing measures aimed at the real estate market is having limited impact so far (link, link). On a MoM basis, both primary and secondary market home prices are still falling at an accelerating rate.
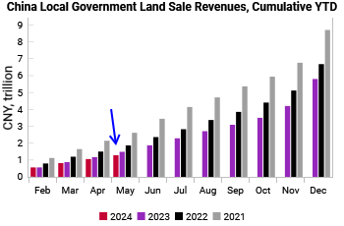
Local government land sales have declined for the past 4 years (third chart), breaking the functioning of local fiscal policy.
The weak animal spirits is also reflected in our key proxy for shadow finance. Non-bank financial institution (NBFI) balance sheet growth typically reflects rising risk appetite, risk-taking and looser regulations. Currently, NBFI balance sheet growth is still stalling.
We remain in “show me” mode, where it will take substantial policy action and signaling to shift private sector sentiment. The old quip is that markets stop panicking when policy makers start panicking.
Expectations are already low for the Third Plenum, but it is hard to tell exactly what would constitute “panic”. Our best guess is we need to see GFC-style substantial monetary and fiscal policy easing from Chinese authorities, as well as clear messaging to re-assure the private sector.
China: unofficial sources of FX support likely exhausting, expect slow and managed RMB depreciation
Our previous deep dive on China devaluation risks in May concluded that Chinese authorities should “quietly allow the RMB to depreciate over time, avoiding big moves that could exacerbate political tensions or capital flight”.
Our China capital leakage proxy continues to show large and persistent leakage through the trade channel (consistent one-way error between reported trade and cash settled for that trade). Chinese new orders and new export orders are also weakening, again suggesting weaker RMB is the path of least resistance.
There is increasing evidence that the “unofficial” sources of FX intervention to prop up the RMB has likely been exhausted. Commercial bank holdings of foreign currency, which surged after Covid, has now been unwound and can no longer be as easily called upon by the PBOC for FX interventions.
Formal net FX purchase data and RMB settlement data (i.e. the capital account data instead of the current account where the trade discrepancy leakage is) is also showing net outflows.
To be clear, “official” FX reserves remain abundant, and the PBOC has likely been accumulating official FX reserves YTD after adjusting for valuation effects. However, the “official” FX reserves are a sensitive number and we suspect the PBOC would prefer to NOT use these reserves and instead manage a slow RMB depreciation.
To read the rest of the report, contact us here.


