Liquidity: theory vs practice
We have seen a lot of narratives on liquidity driving the YTD rally. We think the consensus view of how to use and interpret liquidity in practice is incomplete. The below is an excerpt from our Feb 14th report to VP clients.
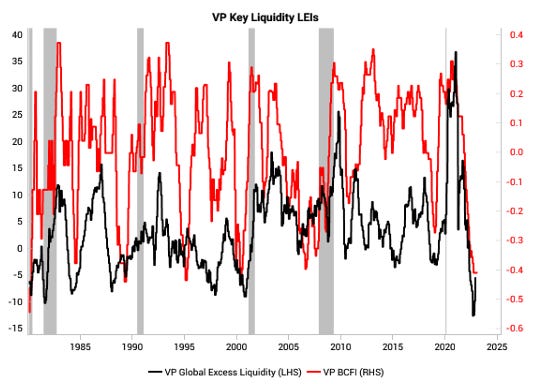
We look at liquidity through VP’s lens of A) BCFI (business cycle financing index, a G20 policy diffusion) and B) Global Excess Liquidity (Global Real M1 Growth minus Economic Growth). Together they provide both a “quantity” and “breadth” measure of liquidity, giving a more complete picture of liquidity for the purposes of setting the cyclical (6-month) investment outlook.
The quantity indicator (global excess liquidity) is starting to turn up off the lows and “technically” bottomed in October 2022, linked to the USD sell-off that our LPPL bubble signal flagged at the time. (We convert country excess liquidity into USD in our final global excess liquidity indicator). The breadth measure (BCFI) remains at the lows, and is set to stay there (e.g. RBA is extending its hiking cycle and Banxico 50bps surprise hike).
In the below chart, we show the long-term history of VP’s Business Cycle Financing Index (BCFI) and Global Excess Liquidity.
Liquidity indicators are calculated off monthly data, so are not pure timing devices. Instead liquidity helps to form the cyclical (6-month) outlook, alongside growth LEIs and our recession regimes. Because most growth leading indicators remain at very poor levels, and our recession indicators are still showing elevated risks, we are not overreacting to the current upturn in global excess liquidity indicator and sticking to our risk-off stance on a 6m+ outlook.
The consensus view on liquidity is centered on central bank balance sheets and the monetary base. This has a few issues in practice:
it does not capture private sector behavior (other than indirectly driving animal spirits due to central bank signaling)
when it does work, it is a coincident measure and not empirically leading
spurious statistics are often used to overstate the correlation
these measures are only suited to the post-GFC period, whereas VP’s BCFI and Global Excess Liquidity indicators can be extended back to the 1980s.
In particular, plotting central bank balance sheets against the S&P over the past decade can be misleading, as both series are trending heavily in the same direction.
Regressions of the level of the S&P against central bank balance sheets are spurious and produce a very high R^2 (as will any regression plotting two heavily trending series). In the below table we show the R^2 from regression of the S&P level against G4 (US, China, Eurozone, Japan) central bank balance sheets, G4 monetary base, US GDP and US bank credit.
Running the same regressions on YoY changes shows a much lower R^2. The charts below compare levels (left-hand charts) vs YoY changes (right-hand charts).
In contrast, we get higher and more realistic R^2 when we run the same regressions using VP’s preferred liquidity definitions. For example, on a coincident basis, global real M1 YoY has an R^2 of 30% with the S&P 500 YoY over the same time period (left chart below). Similarly, for leading relationships, VP’s BCFI has an R^2 of 26.8% with a 12 month lead vs the S&P 500 YoY (right chart below).
Global real M1 growth is only coincident to S&P 500, so it needs to be adapted to be useful for investing. We define Global Excess Liquidity as global real M1 growth minus economic growth. This is used as a contrarian indicator. Money is created from thin air by both central banks and commercial banks, and this newly created money can support real economic activity, inflation or asset prices. To proxy for “excess liquidity”, we take away inflation and real economic activity from money creation.
The good news is excess liquidity is fairly correlated to G4 central bank balance sheets and monetary base, and will give a similar answer the majority of the time. However, there are many periods of divergence of either a) the trend or b) whether liquidity is positive or negative. When there is a divergence between liquidity measures, excess liquidity tends to have much more predictive power for future equity returns at major turning points (bullish and bearish).
Get the full picture at variantperception.com


