Outliers - VP May EM/DM Leading Indicator Watch
This post is an excerpt from our May 23, 2024 Leading Indicator Watch report to VP clients. The full length, original report can be viewed here.
Canada: still G10 outlier, long AUDCAD the play
This year we have repeatedly flagged Canada’s outlook as among the weakest within the G10. We like long AUDCAD to express this view.
Canada’s credit stress remains clearly visible, with very high delinquencies among small business and mortgages in arrears trending higher.
Our policy regime models still show that the Bank of Canada should be among the most dovish G10 central banks…
…but this has been priced into short-term interest rate futures, with Canadian CORRA futures falling much less than SOFR, Euribor or Sonia futures YTD.
Another source of uncertainty is inflation, as our Canada inflation leading indicator is bottoming, making fixed income bets lower conviction.
The cleanest trade now is to go long AUDCAD to play the policy divergence foreseen by our policy regime models. Long AUDCAD is also aligned with our FX edge models, which went long at the start of May (link), as well as our tactical outlook models, which went long at the end of April (link).
Canada is also in the process of raising capital gains taxes from 50% to 67% for wealthy individuals, which will reduce the attractiveness of Canadian assets, compounding the already very negative capital cycle score for Canada. This is a longer-term drag on the currency.
Australia: housing rebound + upside inflation risks => flatteners & long AUDCAD
A recovering housing market, still tight labor markets and upside risks to inflation suggest the RBA will be forced to tilt more hawkish again.
Aussie housing data continues to show a strong recovery. Housing finance growth is accelerating, which leads building permits by about 6 months.
Vacancy rates also remain very low, which will support house prices. Rents are also now growing at 8.5% YoY.
The labor market still looks healthy. The unemployment rate has increased to 4.1% from a low of 3.5% in June 2023, but this is unlikely to be the start of a surge higher. The NAB capacity utilization survey offers a small lead on the unemployment rate and shows that the unemployment rate should stabilize near multi-year lows.
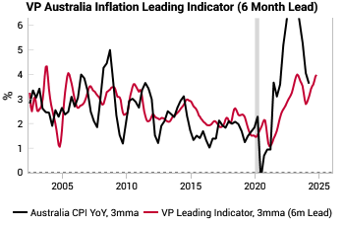
Our inflation leading indicator is also rebounding, pointing to upside risks to inflation.
The May RBA statement showed they are still data-dependent, noting “inflation is still high and is falling more slowly than expected” and that “The Board remains vigilant to the risk of continued high inflation and is not ruling anything in or out.”
We like flatteners and long AUDCAD to play this.
Chile: copper LPPL bubble climaxes suggest taking some profit on CLP
CLP has rallied 8% vs the USD since our April LIW, helped by the copper surge. Now we are seeing multiple LPPL climax bubbles in Copper (link), suggesting taking profit on CLP and waiting for a better entry point again.
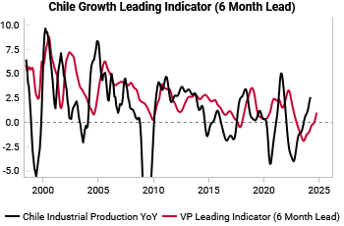
The macro outlook in Chile flagged last month remains the same: a) diminishing political risk b) improving growth outlook, levered to upside in commodities and c) bottoming inflationary pressures.
Rising copper prices greatly benefit Chilean terms of trade, as copper represents 45% of the nation’s exports. This has also led to an improving outlook in manufacturing, which has been the largest contributor to the ongoing improvement in our Chile growth LEI.
April CPI data came in hot (link), corroborating the continued rise in our Chile inflation LEI. This increases the chance of a hawkish surprise by the Chilean Central Bank’s, with markets currently expecting a 50bps cut.
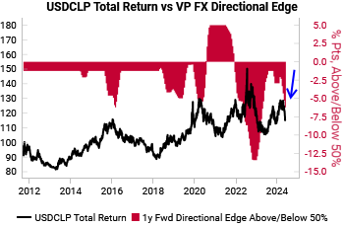
Our FX Edge model still favor a stronger CLP (lower USDCLP) on a 12 month forward basis. CLP has also seen a much bigger drawdown from 52w highs vs EM peers (link).
Brazil: equities still seeing outflows, fundamentals attractive
The equity market remains our favorite way to gain exposure to the attractive Brazilian growth outlook. Our growth leading indicator continues to trend higher.
Despite the ongoing improvement in the Brazilian growth outlook, domestic equity markets are very uncrowded relative to history.
Brazilian equity markets are still seeing outflows, ranking in the bottom 5 on a trailing 1m, 3m, 6m, and 12m on a global cumulative flow basis. This creates an attractive entry opportunity as Brazilian equities remain positively levered to the ongoing global growth rebound.
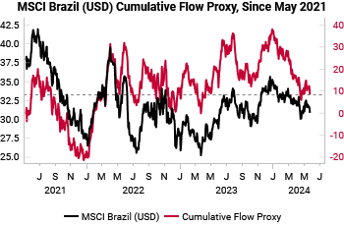
Our cumulative flow proxy suggests Brazilian equities are trading near recent support levels.
While the MSCI Brazil Index has a negative capital cycle score, this is greatly skewed by Banks, which represent ~16% of the index.
The majority of underlying industries are capital scarce. We continue to like long Brazilian equities while avoiding banks if possible.
To read the rest of the report, contact us here.


