Principles that have helped us the most
Following on from our series of posts on the tools that have helped us the most, we share 5 principles that have guided VP’s analytical framework. Excerpt from the VP Cookbook, June 2021.
Principle #1: Think in regimes
How did you go bankrupt?...Gradually, then suddenly. - Ernest Hemingway
Economic and financial variables don’t move in a straight line. The presence of reflexive feedback loops means that cause and effect can switch. Banks are quick to tighten lending standards when the economy turns down, but in downturns is when companies most need to borrow. An inability to borrow forces companies to default, further exacerbating the economic downturn (see behavior around grey bars = recessions).
Feedback loops can be seen in many physical processes, eg “S curves” in consumer adoption of tech goods or phase changes in ecological systems.
Many of our tools are built as regime-switching models. Identifying a regime shift in real-time, i.e. recessions, is extremely valuable because markets are slow to price in a change of leadership.
Principle #2: Seek turning points & divergences
The trick in investing is just to sit there and watch pitch after pitch go by and wait for the one right in your sweet spot. - Warren Buffett
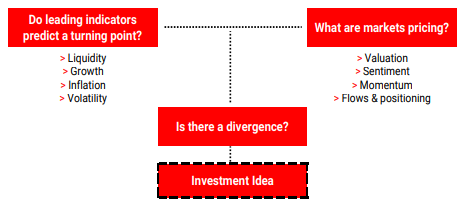
Turning points are where the most profitable investments are made. Our leading indicators are geared towards identifying turning points in real-time.
Catching turning points is just half the story. Once a turning point is found, we look at market data to understand whether it has been priced in.
A real-world example: the left-hand chart below shows our Brazil leading indicator in Jan 2016. At the time, coincident data showed an economy in the midst of a severe recession alongside a major political crisis as ex-president Rousseff was being impeached. The upturn in leading indicators gave investors confidence that most of the bad news was already priced into Brazil asset prices.
To paraphrase Howard Marks in The Most Important Thing: it doesn’t pay to be contrarian for contrarian’s sake, but thankfully there is always a cycle to rely on.
Principle #3: Respect the cycle
Every failure brings with it the seed of an equivalent success. - Napoleon Hill
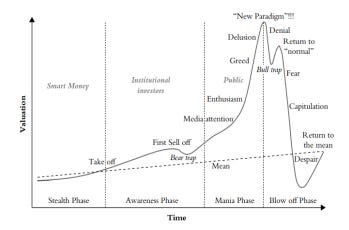
The greatest investment returns start from a point of discomfort, disgust and capital scarcity. People tend to extrapolate the good and bad times, creating cyclicality and increasing the frequency of extremes. We’ve dedicated a lot of work to understanding how boom and bust cycles progress and have found that they share a common structure (chart below from Jean-Paul Rodrigue).
We apply capital cycle analysis to global industries to provide key insight into competitive dynamics and identify the most loved and hated companies.
The best cyclical returns can be found in hated industries that are starved of capital, beset by bankruptcies and devoid of spending on new projects. But this doesn’t last forever as high returns attract a new wave of capital and new entrants that drive up competition and crush future investment returns.
Principle #4: Invert the problem
All kinds of problems that look so difficult, if you turn them around, they are quickly solved. - Charlie Munger
Most stocks are not worth investing in over the cycle and most fail to beat T-bills (Do Stocks Outperform T Bills? - Bessembinder, 2018). This is because most companies operate in competitive markets and cannot survive over the long-term. Long-term losers tend to be found in cyclical, capital-intensive industries.
From a stock-picker perspective, we use tools to screen out bankruptcy candidates. The KMV score measures the probability that a company is going to default in one year (using an option framework to estimate the value of a company’s assets vs its debt). The bottom quintile of S&P 500 companies ranked by KMV scores dramatically underperforms.
From a top-down allocator perspective, we identify countries that run “inverted balance sheets”, i.e. leveraged up in the good times on short-term debt denominated in foreign currency (discussed by Michael Pettis in The Volatility Machine). Our external stress scores tell us which countries are the main crisis candidates by looking at trends in current account deficits.
Principle #5: Be data-driven
A man plus a machine beats a machine. - Gary Kasparov
Leading indicators guide us on where to hunt and qualitative analysis is then needed to judge if the thesis makes sense. This allows us to spend the majority of our time drilling down to single-name investments or other specific trade expressions to generate the most asymmetric risk/return profile.
As Paul Marshall writes in 10 1/2 Lessons From Experience: “Machines typically do not fare well in a crisis. They are not good at responding to a new paradigm until the rules of the new paradigm are plugged into them by a human.”
The world is becoming a noisier place. Occam’s razor is a VP favorite that guides our construction of leading indicators and investment decisions - the explanation requiring the fewest assumptions is most likely to be correct. In other words: less is more.
Get the full picture at variantperception.com


