Reflation Sensation
Bloomberg and Google news trends show reflation headlines are everywhere. Widespread coverage is typically a sign that trends are starting to exhaust and that markets are due for a period of consolidation, before the next leg higher
Our growth and liquidity LEIs remain very positive. While we don’t want to be contrarian for contrarian’s sake, when we observe the prevalence of news stories about reflation, it does suggest extreme sentiment and scope for a short-term reversal in reflation trades.
The reflationary price action itself looks extreme. Our standardized score of reflation relationships has stretched to almost two standard deviations above the mean.
To gauge how extreme reflation narratives have become, we look at news trends (from Bloomberg news stories and Google Trends) alongside company earnings transcripts. We look at the total number of weekly news stories with references to reflation as percentage of total news stories.
The two charts below show that when coverage is as prevalent as it is today, it has usually been at the end of big price moves, and often points to a period of consolidation in prices. We plot peaks in “reflation stories” against the equal-weighted S&P and US 10y yields.
The BIS has created a retail investor sentiment proxy using Google Trends data. They average trends from indices (S&P, Nasdaq), financial news outlets (CNBC, Yahoo) and discount brokerages (Schwab and Ameritrade). 100 indicates maximum popularity, telling us that retail sentiment today is still frothy.
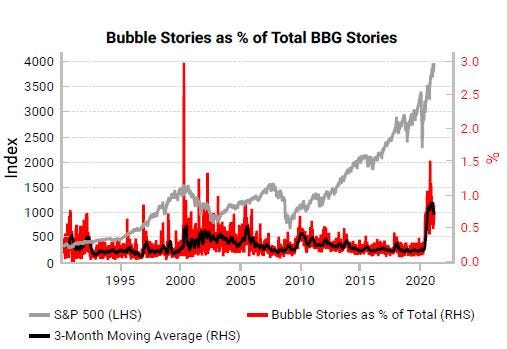
Google Trends data only goes back to 2004 but we can look at Bloomberg news stories to capture the “insider” view. Looking at “bullish” vs “bearish” stories, the net trend hasn’t been as extreme as the dot.com bubble nor the early 2000s.
But bubble risks are getting more attention.
Overall, news trends and price action tell us that the reflation story has got a little ahead of itself and is setting up for short-term disappointment. But wider risk sentiment is not at peak bubble levels, as we see a healthy level of fear among investors.
Commodity supercycle stories have also seen an incredible surge in volume. When we first detailed our bullish thesis in May 2020 and then in a wider thematic in October 2020 (The Next Commodity Supercycle), there was much less optimism around the theme. Today, the interest is very extreme, as the chart below shows (grey line of supercycle stories in lower pane).
Google Trends data shows similar behavior, though it shows that today’s coverage is not too distant from the early 2000s.
In either case, when historical coverage has been very high, the immediate short-term performance of commodities has been disappointing. No market moves in a straight line, and a longer trend, such as a supercycle, will likely experience at least one and perhaps more larger sell-offs, as early investors take profit, and some try to short believing the trend is over.
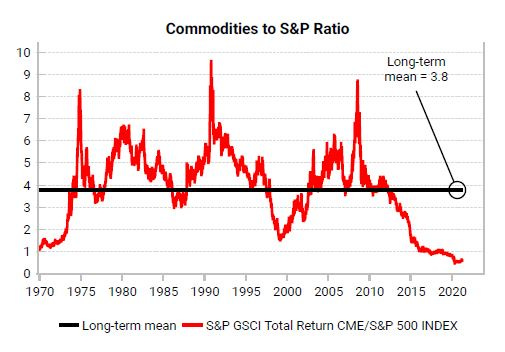
Structurally, over the next 3-5 years, we still think there is a lot of room for commodity prices to run, given that the recent rally has barely dented the long-term undervaluation of commodities relative to equities.
But the surge in supercycle stories has been met with stretched positioning data, increasing the risks of short-term disappointment.
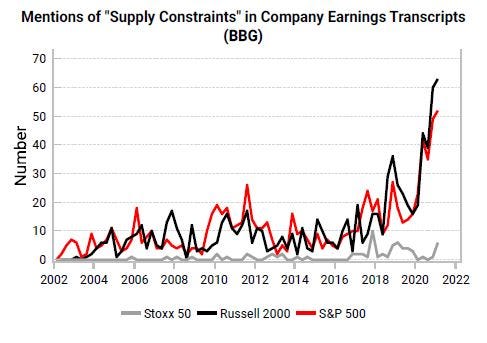
Finally we look at company earnings-transcripts data to get a sense of how businesses are thinking about the environment. If companies grow more confident in their ability to raise prices, this can be an early warning sign for wider goods inflation. Supply constraints are well known and producer surveys confirm these bottlenecks.
But wider inflation is not top of mind for many firms at the moment. Given this data is collected through the quarter, it’s not a timely lead for headline CPI, but changes in trends capture turning points fairly well. An earnings-transcript analysis is a useful confirmatory tool for the path set out by our leading indicators.


