The VP TLDR Guide
3-minute summary of the 10 most important VP whitepapers from our “VP Understanding" series.
We have written a series of whitepapers over the years covering our proprietary models and thematic research, which we frequently cite in our posts.
To better understand our approach, see the below summary of VP's 10 most important whitepapers + concepts
#1 Capital Cycle 3.0
Capital cycles are powerful predictors of long-term equity returns: over-investment is a destroyer of capital and should be avoided, while capital-starved industries/regions consistently outperform.
Our capital cycle scores help quantify competition. Too much competition reduces future profits and vice versa. This helps us with idea generation for new investments.
We define capital scarcity by using three ratios: capex + R&D as % of assets, marginal operational return on invested capital (ROIC), and depreciation and amortization as % of assets.
#2 Understanding LPPL
Tops and bottoms tend to occur around an LPPL climax, marking the panic/euphoria moment.
LPPL stands for log periodic power law. It’s a better way to predict the end of trends vs standard technical analysis or parabola fits. We use LPPL for reversal trading opportunities.
If an LPPL pattern is detected early enough, it can be an invitation to ride the bubble or crash.
#3 The Hierarchy of Money
We generalize all the different theories on liquidity for investing.
The VP “Mehrling” Multiplier measures the “margin of safety” embedded in the monetary system, very similar to P/E ratios for equities.
We take a first principles approach to define liquidity - its level, price, and rate of change.
#4 Understanding Country Leading Indicators
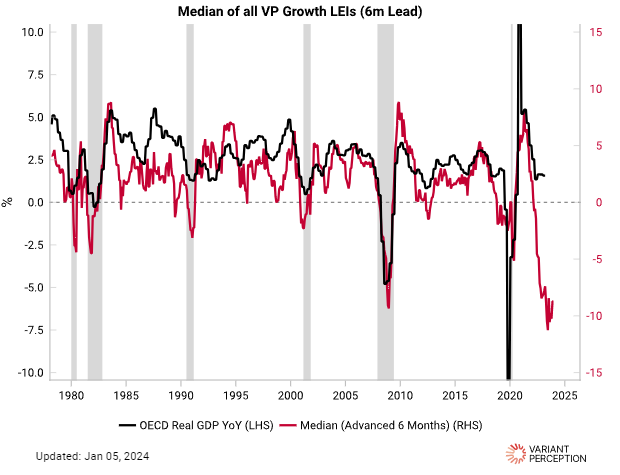
Economies tend to behave in a predictable sequence, with leading data experiencing turning points before coincident data, which in turn see turning points occur before lagging data.
Leading indicators are foundational for us since VP’s founding in 2009. We have leading indicators of growth and inflation for 30 of the worlds’ top economies.
We are transparent in the inputs used. For example building permits, credit spreads, real M1, expectation surveys are some of the best leading data etc.
# 5 Understanding Recessions
Recessions are regime shifts - a cascading process like water turning into ice; they occur when “hard” economic data and “soft" survey / market data get caught in a negative feedback loop.
The biggest data revisions tend to be at turning points in the cycle and tend to be too optimistic heading into recessions.
Equity markets in almost all cases begin to sell-off before the recession begins.
#6 Understanding Inflation
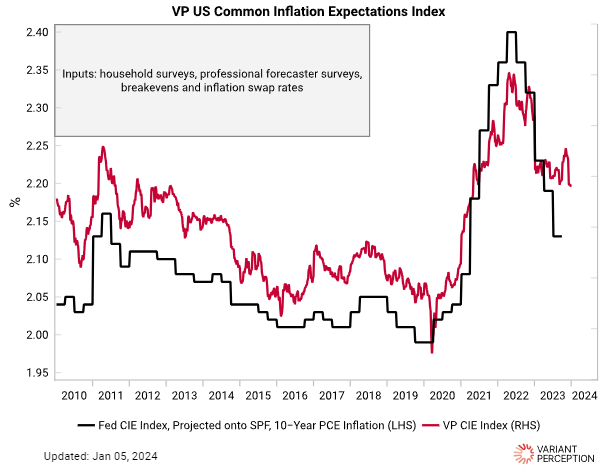
Historical case studies and data show that inflation is either anchored or unanchored, and this usually coincides with the political regimes.
Inflation expectations are critical to track the likelihood of a short-term increase in inflation becoming persistent.
Drivers of inflation are cyclical (growth, labor, commodities prices) and structural (money supply growth, global trade, technology).
#7 Tactical Cookbook 2.0
Our Tactical models are used to help generate trade ideas in a repeatable and backtested way.
We group VP’s suite of tactical tools into trend or mean-reversion.
The highest conviction tactical signals are: LPPL and breadth squeeze signals in equities.
#8 Understanding VP Analog
VP Analogs use Dynamic Time Warping to find “base case” forward return expectations for asset prices based on the past.
VP Analogs flag both trend-continuation and/or mean-reversion patterns, resulting in an indicator with low correlation to price and other traditional technical analysis indicators.
We think of the VP Analog as a tactical indicator to add conviction to directional views.
#9 Understanding Short Squeezes
The best trading/investment opportunities are when you can take the other side of forced selling/liquidation.
Equity short squeeze risks can be defined along two dimensions: idiosyncratic and market dimensions.
VP quantifies “forced selling” to flag tactical buy opportunities by utilizing autocorrelation signals, thrust signals, and selling exhaustion signals.
#10 Understanding Crowding
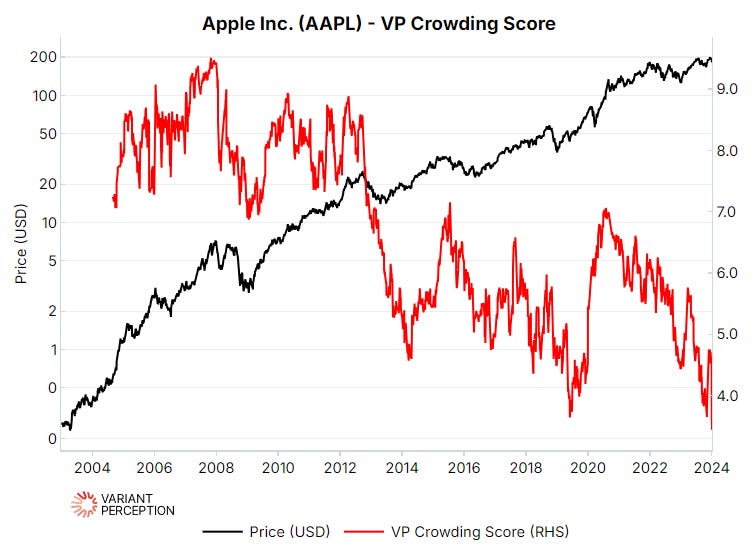
VP’s Crowding Score gauges the popularity of a stock relative to its peers.
We measure success using three metrics: quadratic beta, stock’s volatility difference, and stock’s price action following its quarterly earnings call.
Quantifying crowding helps control tail risk over earnings.


thanks for sharing