Tools that have helped us the most #3
This is the third post in a series where we share the best tools and principles that have helped us understand the business cycle. The third tool below is liquidity indicators - excerpt from the VP Cookbook, June 2021.
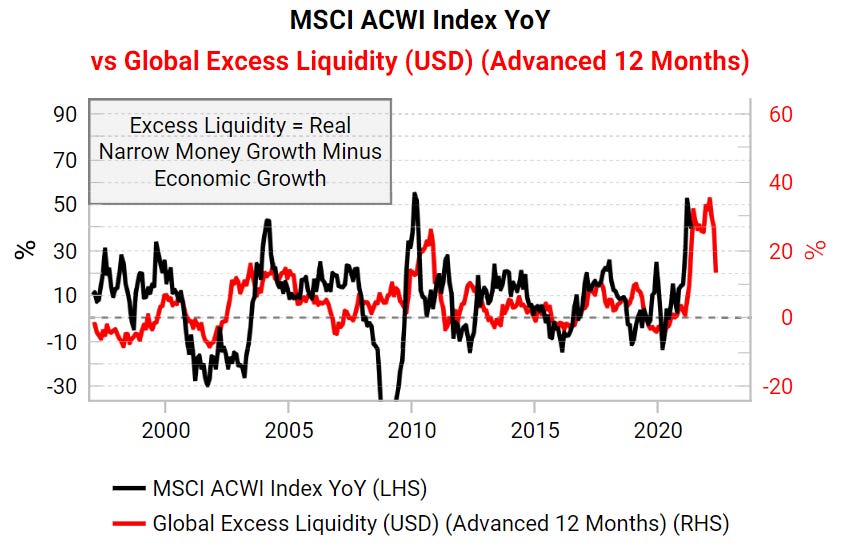
Liquidity is the lifeblood of markets. Our preferred measure of liquidity is excess liquidity - real narrow money growth less economic growth - as it is intuitive and has a proven, empirical lead on equities and commodities. Excess liquidity has the desirable attribute of being innately contrarian: it peaks when sentiment is very poor and central banks panic by expanding the money supply, but economic growth has not yet picked up to absorb it.
Source: Bloomberg, Macrobond, Variant Perception
We view excess liquidity as a safety net. When it is high and rising, it is difficult for risk assets to sell off too much. However, as it falls, the safety net is lowered, and any correction in risk assets has the potential to be larger. Liquidity also helps us make relative value calls within asset classes. When excess liquidity is surging, this tends to spillover into riskier assets like EM as investors chase higher yields. We have built a regime indicator that tells us when EM equities are likely to benefit asymmetrically from liquidity-driven tailwinds.
Source: Bloomberg, Macrobond, Variant Perception
Get the full picture at variantperception.com


