US Leading Indicator Watch
Leading indicators for US growth, consumer, labor, manufacturing, housing, and inflation.
This post is an excerpt from the US section of our September 6, 2024 G3 Leading Indicator Watch report to VP clients. The full length, original report can be viewed here. To gain access to more of our research, contact us here.
US growth: slowing, but no imminent collapse
The poor ISM data reignited recession fears, but the balance of data we track shows the US growth outlook is for moderate slowing, not recessionary collapse.
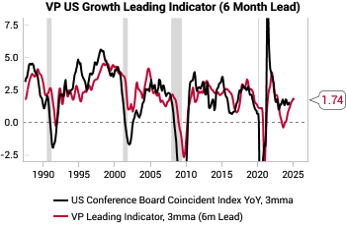
Our main US growth leading indicator ticked down this month with a point-estimate of 1.7% YoY, weighed down by the manufacturing and housing data, but held up by credit and services.
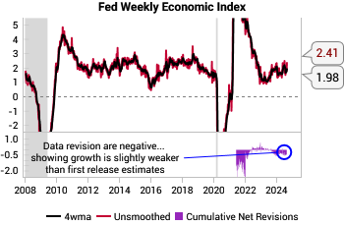
The Fed Weekly Economic Index shows growth is still running around 2% annualized.
The Atlanta Fed GDPNow also corroborates the 2% number. As a reminder, we strip out the volatile components from GDPNow and focus only on the private sector consumption and investment components. For added context, Bloomberg’s GDP Nowcast is at 2.1% and the NY Fed is at 2.5%.
The US fiscal impulse is also stabilizing with the T3M impulse vs 1y ago now basically flat.
In summary, we see no reason to panic on US growth, but equally this is not the all-clear signal on equities given the lofty expectations already embedded in consensus EPS forecasts. FactSet data shows consensus expects 10.1% growth for CY 2024 and 15.3% for CY 2025.
US consumer: bifurcated stress, but in aggregate holding up, leading indicators are recovering
There are elevated fears for the US consumer given some concerning anecdotes during earnings season, but leading indicators and aggregate data are more benign.
There are obvious signs of stress among lower-income consumers with a sharp divergence in personal finance sentiment for the bottom 2/3rds by income vs the top 1/3rd. This stress is also clearly visible in elevated auto and credit card delinquencies (link).
However, we see a more benign picture. Our consumer pressure proxy (wage growth relative to rent, medical and credit card) has been recovering.
GDPNow for private consumption is running at 1.7%, which is in line with the last 2 years.
Most surprisingly, our main US retail sales LEI has been rising. The main positive contributors are easing credit conditions, low jobless claims and services new orders still growing. We are a little skeptical of the magnitude of the recovery, but it does suggest the outlook is not as negative as the headlines would suggest.
There are additional structural tailwinds for consumption via 1) de-levered consumer balance sheets 2) elevated personal transfer payments from governments 3) boomers retiring and 4) still contained debt service ratios. See our previous report, US consumer: what's different this time?, for more.
US labor: slowing, not collapse, but risks are rising
US labor market data is consistent with slowing, not collapse, but risks are rising.
The most notable new marginal negative is the continued deterioration in the surprise and revision trends for the non-farm payroll data. On a cumulative T3M basis, both the initial release surprise and the subsequent revisions are now negative, the first time in this cycle.
For now, we think the labor trend remains moderate deterioration rather than collapse. The Conference Board survey of job expectations leads the unemployment rate and has been mostly trending sideways.
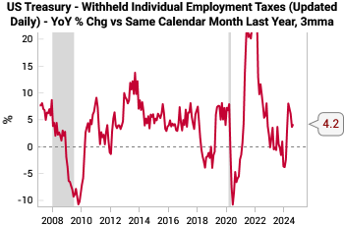
The risk that the headline data is wrong and will need to be revised lower has diminished vs 2023. The daily updating treasury data on withheld employment taxes is a real time proxy for labor market conditions. It did not grow throughout 2023 but has returned to growth this year.
Finally, we are still very focused on layoff trends as a sign of more imminent risks for the labor market. The Challenger layoffs jumped again in August to 75.9k, with a big contribution from legacy tech companies like Intel. However, such levels of layoffs are not uncommon historically and the key is seeing if layoffs accelerate from here.
US manufacturing: ISM a big worry, but election uncertainty is a factor, while delivery times are still rising
The collapse in the ISM new orders to inventory ratio below 1.0 is a big concern. A drop below 1 is not a guarantee of recession, but it is the fuel for at least a growth scare.
The ISM manufacturing drop was confirmed by the S&P Global PMI, which also dropped below 50 in August…
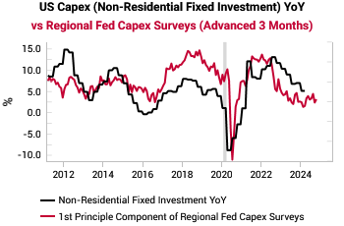
…while the regional capex surveys remain anemic.
However, there are some signs that election uncertainty is weighing on new orders and capex decisions. The ISM report itself contained quotes about “uncertainty around the election” and “business is cooling down, and we don’t expect a rebound until after the election is over”.
This was also a feature of earnings season. For example, Applied Industrial Technologies described “uncertainty around the upcoming US election” while Crown Holdings stated “regardless of which party wins the election, at least we all then know who's in charge...And that will drive how companies spend money”. FNB stated “pipelines have declined somewhat given… the typical pause in client activity leading up to the presidential election”.
It is also notable that the regional manufacturing surveys on delivery times have been trending higher. Historically, rising delivery times have marked the end of manufacturing recessions as spare capacity is used up.
US housing: multi-unit permits collapse, but house price LEI propped up by improving lending standards
There are some optimistic signs for US housing against a backdrop of obvious stress.
Housing headwinds have been clear and obvious for the past 2 years, with very low affordability. The past 2 years are the first sustained period since the 1980s that the median US income did not qualify for a new standard 30-year mortgage.
With the Fed set to cut and with lending surveys showing that mortgage standards are starting to ease, the headwinds should start to diminish.
Our overall US house price leading indicator has recovered from the 2023 lows and has a point estimate of 6.3% YoY house price growth.
There is currently a stark difference between single family and multi-family building activity. Multi-family building permits have collapsed (black line in below chart) while single family permits have slowed more gently and look to be back to pre-Covid trends (red line in below chart).
We retain our structural bullish thesis on US single-family homebuilders.
US inflation: not out of the woods, but minimal stagflation risks
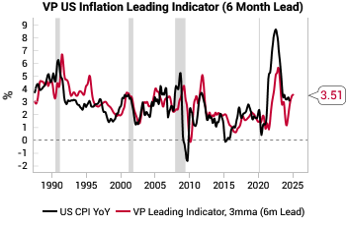
Our US inflation leading indicator ticked down last month to a point estimate of 3.5%. Overall, the message is the same as last month: on balance there is more good news than bad news on the US inflation outlook.
Key leading indicators of US inflation appear to have reached their peak and are now showing a gradual downward trend. Our main US inflation model factors in critical metrics such as Fiber inflation, NFIB price plans, and ISM services and manufacturing price indices. All of these indicators have peaked and are now gradually easing.
The SF Fed’s supply vs demand driven core PCE model is one of our preferred ways to measure stagflation risks in the economy.
After the supply-driven inflation surge at the start of 2024, the T3M average of supply-driven core PCE has fallen to 0.1% on an annualized basis, while the demand component is at 1.6%. As long as this holds, any slowdown in growth will also drag inflation lower, reducing stagflation risks.
YoY growth in savings deposits are still negative but improving, which has historically offered a good lead on median CPI. Intuitively, changes in savings deposits reflect changes in spending intentions.
To read more of our research, contact us here.









Here are my Aug PCE estimates:
https://arkominaresearch.substack.com/p/aug-pce-inflation-estimate?r=1r1n6n
Great summary 👍