VP Tactical Cookbook 2.0: Evolving the Investor's Toolkit (Part 1)
“Sometimes the questions are complicated, and the answers are simple." - Dr. Seuss
Tactical, Cyclical, Structural
Our investment framework integrates insights across three time-horizons:
Tactical (1-3 months): “Playing the game”, LPPL bubbles/crashes & flows/positioning;
Cyclical (6-12 months): Leading Indicators of the business cycle and liquidity cycle help to set the medium-term road map;
Structural (2-3+ years): Industry capital cycles determine long-term outperformance.
In January 2022, we explained the key elements of our tactical framework at the time, which we shared in a 3-part series of blog posts last year. Today, we share the progress made since then in VP’s Tactical Outlook 2.0, first published on April 24th.
Harnessing Intuition with Tactical Models
Our philosophy remains rooted in the timeless principles of trend-following and mean-reversion. We're not here to reinvent but to refine with enhanced data and methodologies.
An experienced portfolio manager's intuition is a reservoir of data amassed over the years. Back-testing and building models from first principles aim to expedite this data assimilation.
The Challenge: Contextualizing Market Timing
Market timing without context is akin to navigating a maze blindfolded.
Our tactical models, operating within a 1-3 month horizon, complement our primary focus on cyclical and structural horizons. These tactical signals are a valuable part of the toolbox, offering marginal gains over time.
Beyond Traditional Technical Analysis
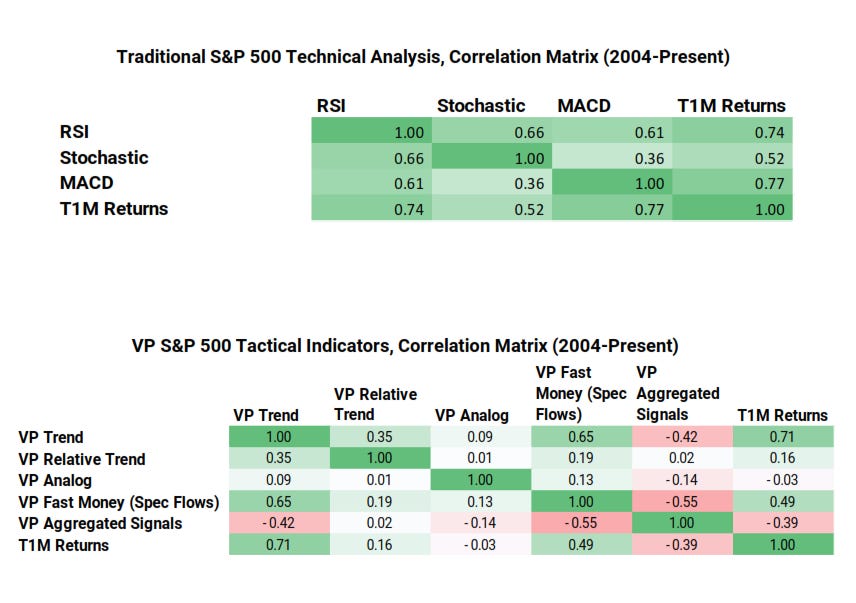
Traditional technical analysis indicators tend to be variations of similar concepts and are often highly correlated to each other and the price itself. We needed additive inputs that are intuitive and less correlated.
Finance is an imitation game where alpha decays over time. VP’s tactical indicators employ diverse methodologies that complement one another. We prioritize building indicators with inherent barriers to entry (e.g. require unique mix of data science techniques or large compute requirements).
Simplicity in Blending
Our suite of tactical tools is categorized into trend and mean-reversion.
Snapshot with linkage between tactical tools and their aggregated outputs
Avoiding Overfitting: Focus on Extremes
We reduce overfitting risks using the same models / thresholds across an extensive range of assets, resulting in realistic win-rates and returns in line with previous research. As our tactical outlook score rises, so does the average 1-month forward performance, as the chart below shows.
A long-short factor portfolio, rooted in our tactical outlook's extreme scores, serves as a basic proof of concept. The accompanying chart illustrates this, consistently favoring the top 15% of securities while shorting the bottom 15%, adjusted for volatility.
VP’s Solution: A Balanced Approach
VP’s Tactical Outlook 2.0 is our updated take on how to combine trend and mean-reversion indicators.
While the trend component identifies potential new tactical trends, the mean-reversion components act as stabilizers. The efficacy of our tactical tools is evident, with a long-term average R^2 of 0.34, indicating the significance of tactical factors.
This wraps part one of VP’s Tactical Cookbook 2.0. In part two, we will dive deeper into the back-test implementation and a couple of case studies.
For more insights into our investment framework, visit


