VP Tactical Cookbook part 3: buy/sell signals
This is the final part of our series exploring our tactical 1-3 month investment framework: buy/sell signals. See Part 1 (key concepts) and Part 2 (trend, sentiment, analog). The below is an excerpt from our January 2022 thematic report to clients.
Our tactical signals are defined by patterns and conditions that give a probabilistic edge on price behavior. These signals fall into two broad categories.
Equity Index Signals look within the indices and activate when the collective behavior of index members meet certain conditions: VP Thrust, VP Selling Exhaustion, VP Hilo Crossover.
Cross Asset Signals apply to a range of markets because they only use price and volume data: VP Correction, VP Divergence, VP Technical, VP LPPL Climax, VP LPPL Breakout.
VP Thrust (buy):
The signal tracks the ratio of advancing to declining stocks in an index. When the advance-decline ratio has been abnormally low for a prolonged period, it strongly suggests a near-term rally is likely.
The left chart gives an example of signals triggering on the S&P 400 Midcap index. The right chart shows the performance of breadth thrust signals from 2007 until 2021. This is the average performance of equity indices into the signal (t=0) and the subsequent 90 trading days of performance, with the 20th-80th percentile range. We also split the performance by period (bottom table). The average 3-month return and skew of returns is also good outside of the GFC and Covid crash.
VP Selling Exhaustion (Buy):
This signal tracks the ratio of long and medium term moving averages. When the moving average ratio has been abnormally low for a prolonged period, it strongly suggests a near-term rally is likely.
VP Hilo Crossover (Buy):
This signal tracks net new highs and their crossovers. When all net new highs turn negative and all crossovers disappear, the market is terribly oversold and there might be a turning point at hand.
VP Correction (sell):
A regime switching model that uses a range of volatility, credit spread, and basis spread inputs. This is one of the few risk-off regime signals that works well. The subsequent 50-day performance is very interesting because it is negatively skewed even as the median holds up. This is a very useful signal to buy put options.
VP Divergence:
This signal looks for when the price action is diverging with technical indicators such as RSI, Stochastics or MACD readings. Divergence across many technical oscillators usually signal imminent reversals of price. It marks the end of trends and trend reversals in all asset classes, and works best on commodities, equity buys and currency sells.
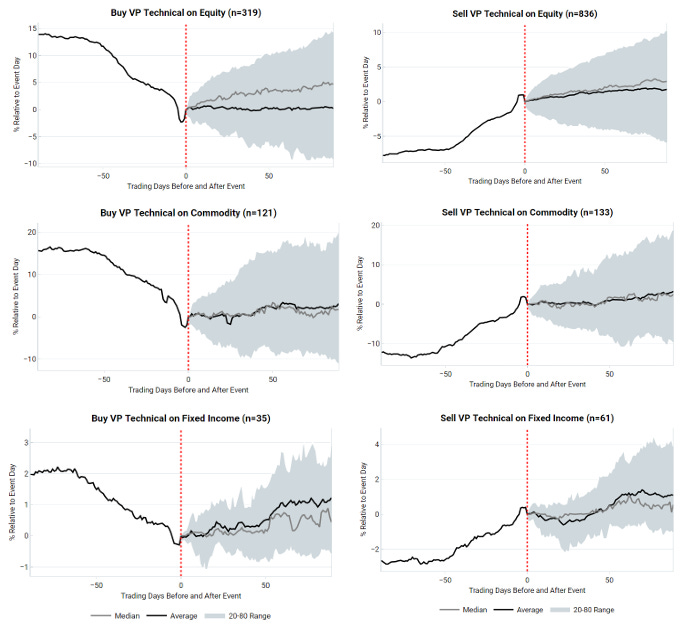
VP Technical:
Inspired by DeMark counts. We look for consecutive counts of 13 lower lows/higher highs as the set up and another 13 lower lows/higher highs for a signal trigger. Consecutive sequences of down-moves are usually associated with the exhaustion of existing trends. On average the signal does a good job flagging trends that have ended.
LPPL Climax:
This model was popularized by Didier Sornette in his book “Why Stock Markets Crash”. He describes LPPL patterns (top right) as an outcome of imitative behavior. If you imagine investors structured into a hierarchical network with a propensity to imitate their neighbors, then LPPLs can naturally emerge from these interactions (see chapters 4, 5 & 6 of his book).
The critical point, or climax, occurs when opinion has become highly uniform. At this point the price becomes very sensitive to clusters of investors changing their opinion. This pattern of opinion formation applies to crashes. Tops and bottoms tend to occur soon after an LPPL Climax. Usually there is a final move to the upside/downside before the turning point.
LPPL Breakout:
An LPPL breakout is best described as large scale disagreement, with investors doing the opposite of their ‘neighbors’. This contrasts to large scale agreement and imitation in LPPL bubbles. Example patterns for the LPPL Breakout are shown in the top charts. As the market reaches a critical point, the price has to breakout. This can go in either direction.
This pattern will look familiar to many practitioners of technical analysis. This is a way to find triangle breakouts and test their performance. Equities break out to the upside on average (bottom left chart). In other assets the breakout direction is mixed. Intuitively, straddles or other long vol strategies should do well after breakouts.
Get the full picture at variantperception.com


