What We Got Right and Wrong (3Q25)
Weekly Wrap, Oct 31, 2025
Variant Perception, Made Repeatable.
Rigorous investment research grounded in auditable quantitative models. No black boxes, no guru calls.
What We Got Right and Wrong (3Q25)
RIGHT:
Being data dependent and anchored to models paid off. While we highlighted the downside risks worth monitoring (e.g., inventory cycle, labor market weakness), the Macro Risk Indicator shifted from neutral to risk-on as the Q3 US “growth scare” played out without turning recessionary.
WRONG:
Most of our misses were about the trade expression/timing rather than the rationale:
UK growth stagnated as expected, but lingering inflation pressure means a SONIA curve trade would have been more suitable;
Our domestic Canada story was right, but price action was overwhelmed by global factors; and
KRW trades demanded quicker narrative shifts.
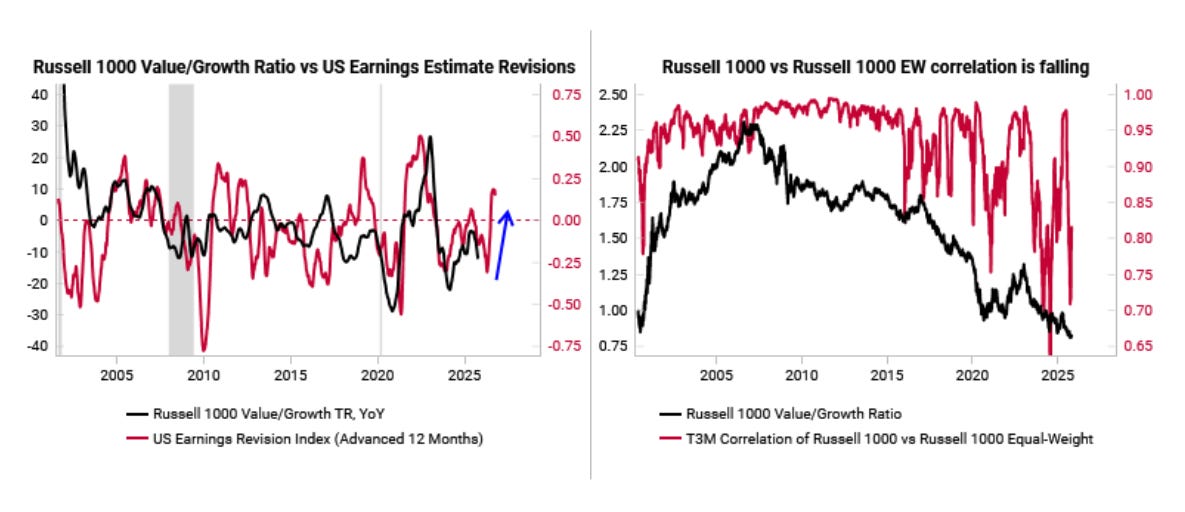
The case for value: from UW to OW amid broadening tailwinds
We are changing our long-held bias against value stocks and recommending a shift to overweight value vs growth.
We are finally seeing alignment across A) market behavior, B) the macro outlook, and C) bottom-up fundamentals.
On our indicators, today’s set up is as good as it has been since the GFC for value to outperform.
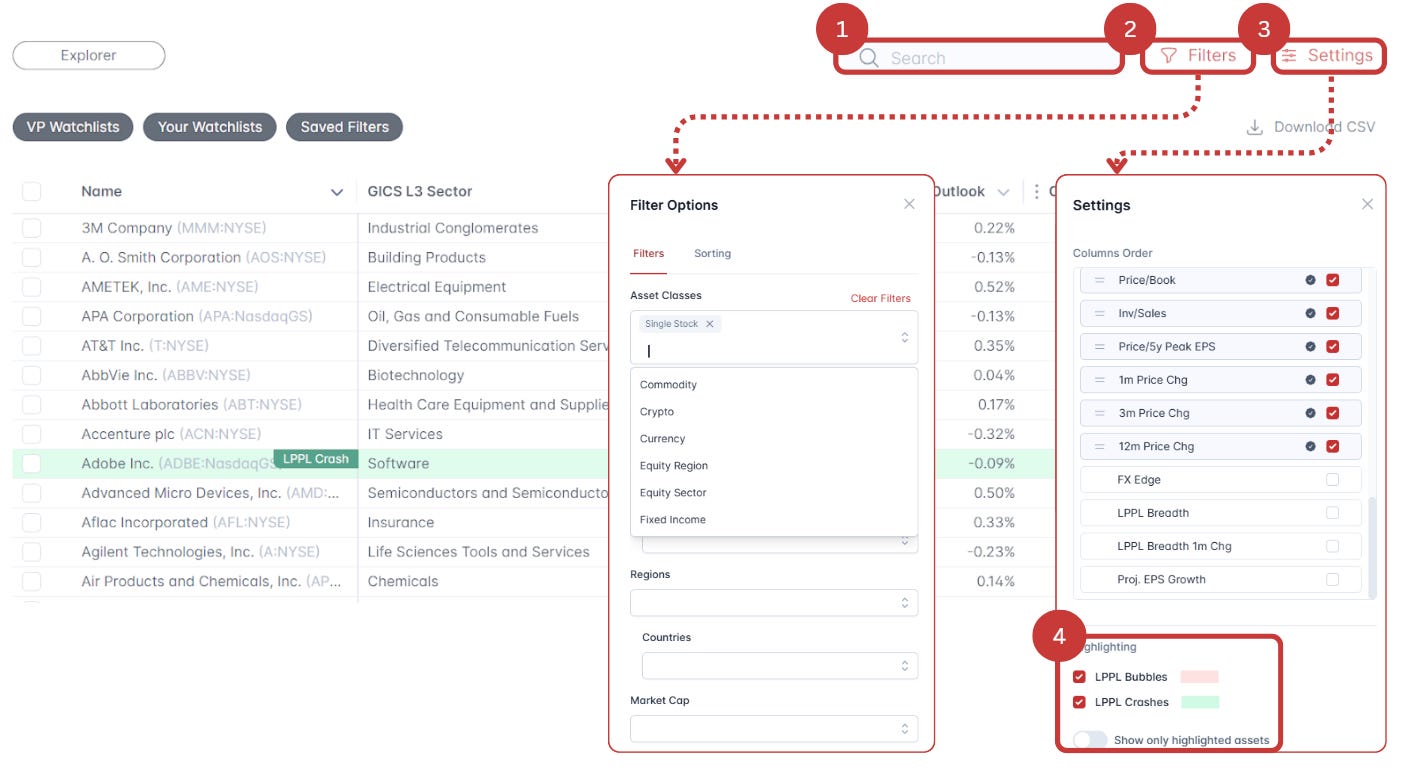
Our New Asset Explorer
Search and filter across all major asset classes (equities, single stocks, fixed income, commodities, crypto, and more).
Select multiple assets to compare and chart with our proprietary models and scores.
Build and monitor your own personalized watchlist.
Create custom scores to filter with.