Where “push” and “pull” align - Jan. EM/DM Leading Indicator Watch
Our Blog Is Moving!
We’re migrating our newsletter to our new website. It won’t affect you in any way — you will instead start to receive the newsletter from info@variantperception.com.
If you’d prefer not to continue, you can opt out at any time here.

US Equity Sectors, Capital Cycle vs Crowding Score. Jan 19, 2026.
The best time to invest is when a sector is uncrowded and capital scarce. Over the past three months, these shifts stand out.
1. Crowded Cyclicals:
Crowding has risen sharply in cyclicals — Banks, Industrials, and Materials. The “reflation” trade has quickly become consensus. This is not itself a reason to sell. But further upside is more reliant on improving economic data.
2. The Tech Anomaly:
Surprisingly, tech remains relatively unloved. Its capital cycle score is till favourable. Marginal returns on investment are holding up and exceed the cost of capital. This keeps tech attractive for growth at reasonable valuations.
Where “push” and “pull” align - Jan. EM/DM Leading Indicator Watch
Cyclical macro tailwinds are strong, and our Macro Risk Indicator remains in “risk on” territory.
Ample liquidity conditions still favor EM assets over DM assets, and we see opportunities in ex-US assets that go beyond the “sell America” narrative and are attractive on their own merits.
This month, we take profit on our short Canadian 10y bonds trade and add a UK SONIA trade to benefit from more cuts being priced in beyond September 2026.
We retain:
long Brazil equities & bonds;
long Indonesian equities & long IDR vs short USD;
long NZD vs short EUR;
and long KRW vs short USD.
Summary by Country:
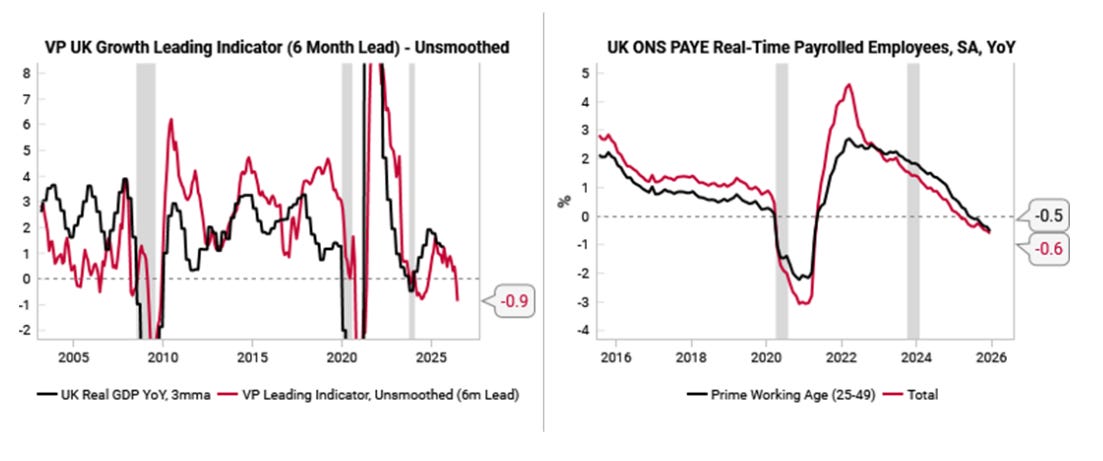
UK: Stagflationary again => more cuts later, not priced into SONIA curve
Japan: “Impossible trinity” back in play => yen weaker before it gets stronger
France: Stable LEIs, equities are outperformance candidate within DM
Canada: Take profit on short 10y bond trade as recession risks priced out
Brazil: Disinflation + signs of growth recovery => stay bullish
Mexico: Growth headwinds persist, MXN poised for weakness ahead of USMCA
Indonesia: Political risks vs improving macro set up
South Korea: Rising growth and inflation to prompt hawkish BoK => long KRW vs short USD
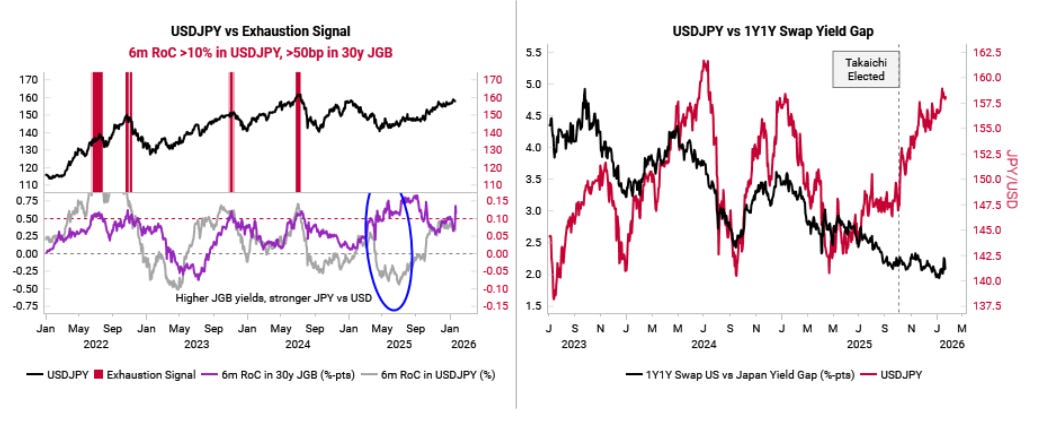
Japan: The “impossible trinity” mechanism + what to watch to buy the yen
The Japan “doom loop” narrative has built momentum over the past six months, as the yen and JGB selloff has become disorderly.
We see some validity to this narrative given Takaichi’s fiscal largesse, the underlying mechanism is that policymakers are being pushed back into Japan’s “impossible trinity” problem.
Basically, Japan cannot have both exchange rate stability and such a slow pace of monetary policy normalization.
Our best guess is that USDJPY goes higher first (i.e., weaker yen) before Japanese policymakers will be forced to take action to exit the “impossible trinity” later this year. There are three key indicators to watch for when to fade the yen selloff.