Where we are tracking: soft vs hard landing (Jan 2025)
This is a Note originally shared with VP clients on January 13, 2025. The original Note can be viewed here. To gain access to more of our research, contact us here.
We refresh our previous work from Nov 2023 comparing today's economic and asset performance to historical soft landings and recessions (since 1960). Today, most US economic data is still in between soft landing and recession. Equities are trading in line with soft landings, while fixed income is performing worse than most historical scenarios.
The key takeaway remains that we would be looking to rotate some equity exposure into bonds as yields surge, while keeping focused on how the US labor market, manufacturing and housing data evolves. US labor market data is most in line with soft landings at present, while the ISM manufacturing and building permit data is still somewhat recessionary. In terms of sectors, this analysis adds more conviction to our energy and consumer staples overweights, but reduces conviction on our financials underweight.
Economic Data
We define the start of the “late cycle” period precisely as the first month that the Conference Board leading index growth rate is 2.5% points below the Coincident Index. Please see the original report for more details (link).
In the following charts, the red line shows today vs the average historical soft landing (purple line, 1966, 1996, 1998), inflationary recession (gray line, 1969, 1973, 1979, 1981) and deflationary recession (black line, 1990, 2000, 2006).
Today, US real goods and services consumption is still growing, but the rate of growth is in between soft landings and recessions.
It is also a middling path for US tax receipts and Core CPI, which have recovered from recessionary levels towards soft landing.
The most optimistic data is from the US labor market, which is mostly in line with soft landings. Non-farm payrolls have continued to grow and initial claims remain low.
The most negative data is the manufacturing and housing data. The Manufacturing ISM and the level of building permits remain much closer to recession than soft landings. Our leading indicators are relatively optimistic that both of these series are set to recover, but these remain key data to keep an eye on in 1H25.
Finally, US M2 growth is starting to recover from deeply recessionary levels and has at least returned to positive growth, but such low growth rates have historically been recessionary. Crude oil prices have mostly trended sideways to lower, which is below any historical soft landings or recessions.
Asset Price Data
Unsurprisingly, both the S&P and forward earnings estimates are fully in line with historical soft landings.
Bonds are underperforming historical recession and soft landing scenarios, while the yield curve has followed the inflationary recession path and is now converging towards soft landing (we use the 1y vs 10y as the 1y data has the most history back to the early 1960s).
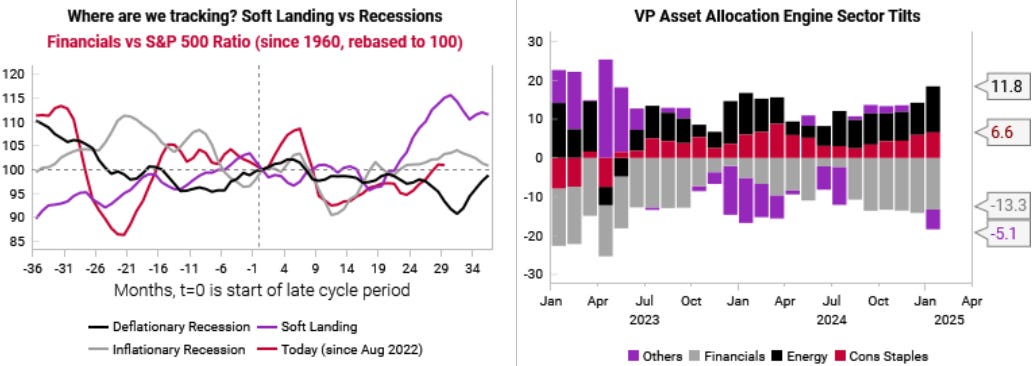
Within sectors, the underperformance of consumer staples and energy is notable and is starting to be below historical soft landing scenarios and well below historical recessions. These sectors are the top sectors right now selected by our asset allocation (AA) engine, so this helps to corroborate our AA engine and add conviction to our energy and staple OW allocations.
The biggest underweight in our AA engine at present is financials, but the historical scenario analysis suggests we may need to discount a little bit the AA engine output. Financials relative performance vs the S&P 500 has been lagging historical soft landings, so there is room to catch up and outperform if/as a soft landing plays out.
Our new chart collections feature on the VP portal lets you easily see all the indicators we are tracking. To gain access to all our chart collections, contact us here.


