
VP Tactical Cookbook 2.0: Back-Test & Case Studies (Part 2)
Anaïs Nin: "We don't see things as THEY are, we see them as WE are."
Overfitting: A Challenge Addressed
Models inherently reflect the biases of their creators. We reduce overfitting risks by:
Testing on a wide variety of assets (equity regional and sector indices, FX, fixed income, and commodities).
Requiring the same general methodology, parameters and trigger thresholds to be applied to all assets.
Have realistic win rates and returns that are in line with previous academic research.
As our tactical outlook score rises, the average 1-month forward performance follows suit.

A long-short factor portfolio based on extremes in our tactical outlook scores gives a great anchor for building trading strategies. The below chart shows a matched notional long-short factor portfolio, which is always long the highest 15% of securities and short the lowest 15% (volatility-weighted).

A Simple Strategy: Actionable with Desirable Risk Properties
We can create a simple strategy based on VP’s Tactical Outlook: long securities with a tactical score >=2 and short those with a score <=2, using inverse volatility weights.
This strategy not only aligns with our "trend-following" with "mean-reversion" objective but also showcases better portfolio properties compared to standard CTA indices:
Sharpe and Sortino ratios have risen
Skew is now marginally positive vs the more common negative skew typically seen in trend-following strategies
Minimal correlation to S&P 500 and CTA index. CTAs generally have low correlation to the S&P but critically their correlation often flips sharply positive in periods of equity stress; our simple strategy maintains a low and relatively stable correlation.

(We assume 10bps of trading costs for each equity/commodity trade and 1bp for bonds and nothing for FX. We use total return indices to allow for the impact of carry, but most trades only last for 1 month.)
Understanding Win Rates: Trend vs Mean-Reversion Trades
Our strategy's win rates consistently register below 50%. However, the profit from successful trades offsets minor losses over time.
Of all trades, two-thirds are trend-following, with the remainder being mean-reversion trades. This distribution accounts for the low correlation to CTA performance. Positions typically remain active for a month.
Equities and commodities resonate best with our system.

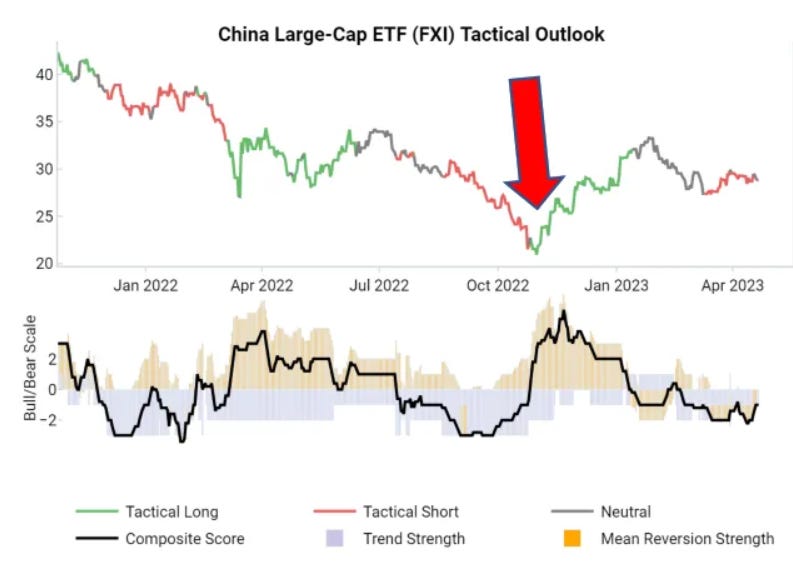
Case Study #1: FXI Tactical Long from Nov 2022
In Nov 2022, our analysis indicated a tactical opportunity to buy Chinese equities.
Snapshot of tactical buy signal on Nov 1st, 2022:
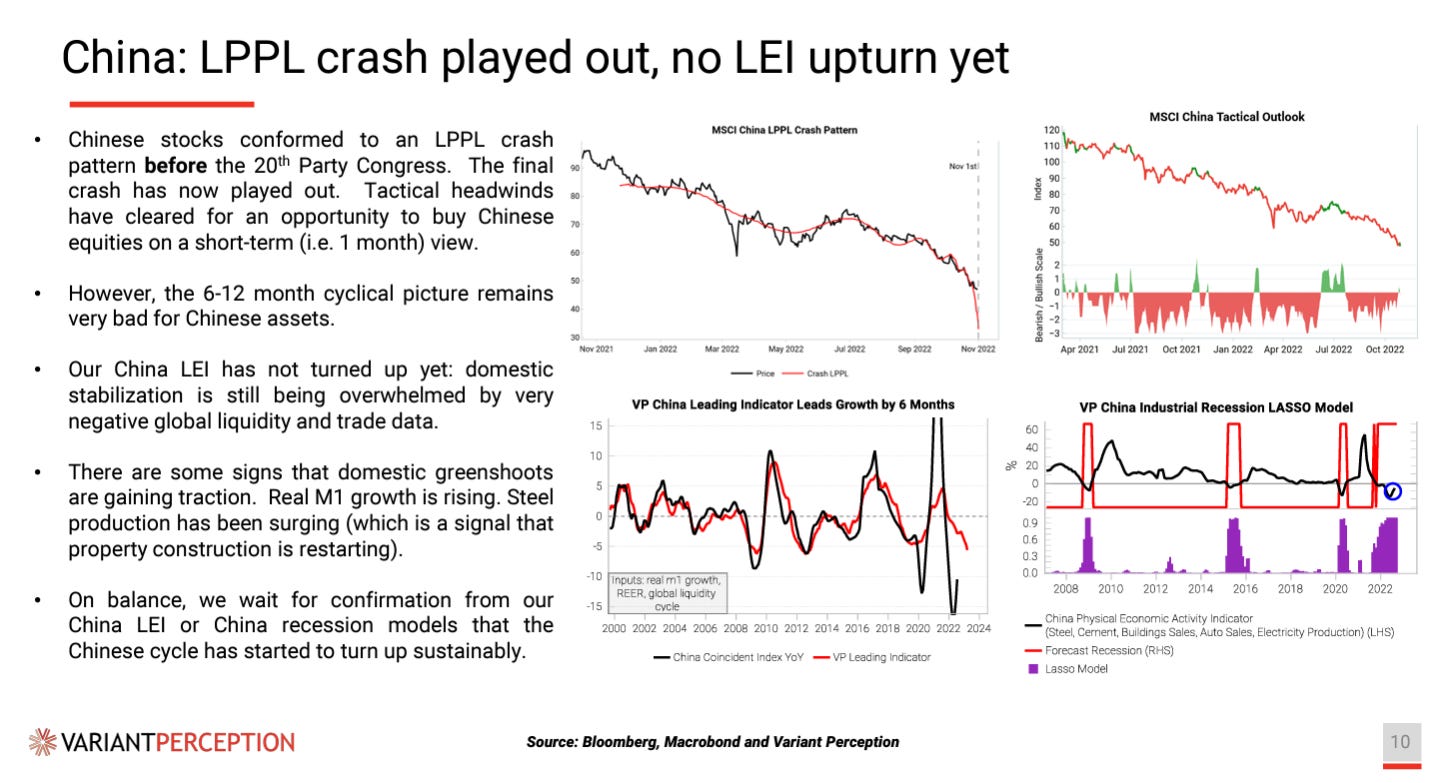
Despite prevailing negative macro data, the tactical FXI long presented a favorable risk-reward scenario, supported by our flow indicators.
Snapshot of tactical buy signals in retrospect:

Case Study #2: Gold Tactical Long from Mar 2023
March 2023 marked our bullish stance on gold.
Snapshot of tactical buy signal on March 1st, 2023:

Our tactical long position was backed by a strong fundamental gold buy signal.
Snapshot of tactical buy signal in retrospect:

This was a trend continuation signal, with gold’s cumulative advance-decline line vs G10 currencies, as well as the price analog, reinforcing the trend's strength.

Areas for Improvement: VP’s Capital Cycle in the Mix
This simple strategy went through an extended period of underperformance in 2015, contributing to a 15% peak-to-trough drawdown. Being a tactical system only, it was not able to factor in extreme capital-abundance (flagged by the capital cycle) for energy and metals & mining at the time, which was a major headwind to any bullish trades.

This is a potential area of further work, where we filter out tactical trades that are up against extremes in the capital cycle.

In summary, in the right context, tactical indicators are a useful part of the toolbox, offering marginal gains over time. Markets shift between periods of extremes in buying and selling, between periods of big trends and volatility.
“The only time I buy at the bottom is when I am desperate to sell and I hit the “buy” button by mistake.” – Harley Bassman
For more insights into our investment framework, visit